Lupine Publishers | Journal of Pediatric Dentistry High Impact Factor
Abstract
Aim: The present study was carried out at Pediatric Nephrology Unit in Zigzag University Hospital to evaluate the dental health status in CRF children.
Design: The dental health status of 50 children under 15 years suffering from CRF were compared results to the results of an age and sex matched control group (n=50). This study was done to evaluate enamel hypoplasia, dmft, DMFT, Gingival Index (GI), Plaque Index (PI), intrinsic and extrinsic stain and the changes in oral microflora including salivary Calcium, phosphorus, alkaline phosphatase and urea concentrations were measured using phenol Sulphur acid colorimetric method. The estimated stimulated salivary pH, buffering capacity and count of Streptococcal Mutants and lactobacilli were determined on selective media of all participants.
Results: The study and control groups did not significantly differ in daily tooth brushing frequency and periodic dental check up frequency. Severe enamel hypoplasia was present in study group. The means of dmft, DMFT and PI were significantly greater in the study group (p< 0.05). The differences among groups for GI were statistically insignificant. Our findings of intrinsic brown staining were 22% and 20% extrinsic staining of patients.
Conclusion: The salivary pH of patients and salivary levels of cariogenic S. mutans and lactobacilli in the study group were significantly lower than the control group, probably due to increased concentrations of antibacterial chemicals such as urea in the saliva of CRF children. The presence of uremia during the development of dentitions cause Intrinsic staining but black brown extrinsic staining due to using ferrous sulfate syrup for treatment CRF children anemia. Although dental treatment need is not high, these children should receive dental health education, including oral hygiene instruction, in order to improve their overall oral health.
Keywords:End Stage Renal Disease Orthodontic; Chronic Renal Failure; Dental; Streptococcal Mutans; Caries; Children; Haemodialysis
Introduction
Clinical Features of CKD in Children
Subjects and Methods
Clinical Examinations
The examination of each patient was carried out using a mouth mirror and a probe according to the criteria of the World Health Organization [58,59]. Each subject was assessed for daily tooth brushing frequency and periodic dental checkup frequency. Following a general appraisal of the mouth, the teeth were examined in both study and control groups for tooth caries, hypoplasia, discolorations, gingival status, and plaque indices.a) Caries Status: Determined by recording the number of decayed (d, D), missing (m, M), and filled (f, F) teeth in the primary and permanent dentitions for each patient and were referred to as dmft for primary teeth and DMFT for permanent teeth.
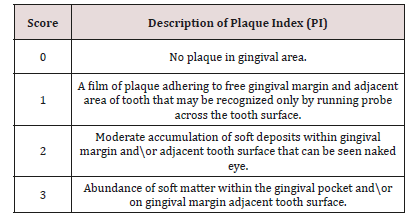
b) Dental Plaque Recording: The deposits were assessed using the Plaque Index. The children were asked for crushing the disclosing tablet or applying disclosing solution for young children and the plaque assessed by numerical scoring of plaque (PI) Plaque Index [60] (Table 2).
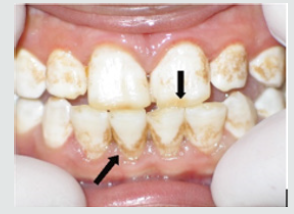
Figure 2: Painted teeth after using disclosing tablets to detect amount of plaque on teeth surfaces.
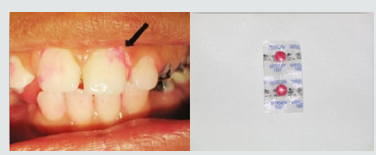

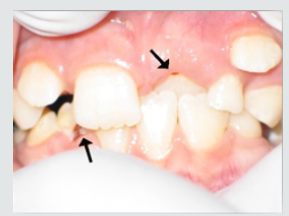
Figure 3: Gingiva of child suffer from CRF from one a year ago with pale gingival color but can bleed easily.
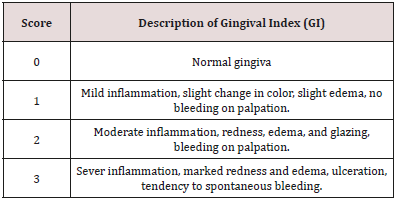
c) Gingivitis Recording: The gum status was assessed using the Gingival Indices The gingiva were examined for inflammation using a Gingival Index (GI) by using mouth mirror and blunt periodontal explorer [61] (Table 3).
d) Discolorations Recording: Detect any discoloration on the teeth of child and differentiate if it was black or brown extrinsic stain or brown intrinsic stain.
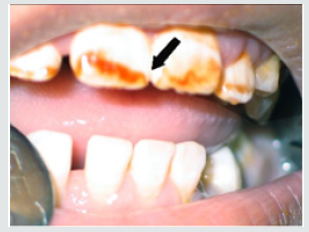
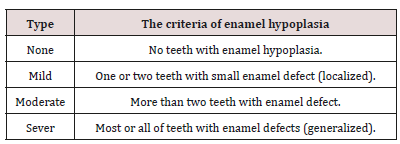
e) Enamel Hypoplasia Recording: Enamel hypoplasia was assessed as (none, mild, moderate, sever) using the criteria determined by Alaluusa et al. [62] (Table 4).
Salivary Tests
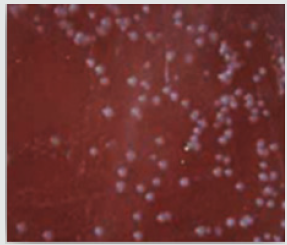
Children in both groups should be without any antibiotic therapy in the last week before the sample collection. For measuring the Streptococcus mutans (S. mutans) and lactobacilli count in saliva by means of selective culture media. Before collecting saliva for the bacteriological counting test, the patients were asked not to eat or drink for at least an hour and salivation was stimulated by having the children chew a paraffin pellet for 5 minutes. About 5ml of the saliva from each child was collected in a sterile calibrated container. The containers were stored in ice for transfer and kept frozen at - 80°C until the time of assay. Each sample was divided into three separate samples in sterile tubes, two of them inoculated onto selective media while the samples was taken. Bacterial counts from each of the different media were obtained and compared. The third sample processed for detect level of salivary calcium (Ca), phosphorus (pH), alkaline phosphatase (AP), salivary urea and salivary pH.a) Streptococcal Mutans count (S. Mutans): About 3ml from saliva samples which collected were stored in a sterile calibrated universal container that were divided into two separate parts of samples, one of them inoculated onto Mitis Salivarius agar media (Becton Dickinson and DIFCO Company, Chicago, USA) was used for isolation S. Mutans that is the selective medium [63]. (Figure 6) Mitis salivarius agar media contents: (Pancreatic digest of casein 6gm, Proteose peptone 9gm, Proteose peptone 5gm, Saccharose 50gm, Dextrose 1gm, Dipotassium phosphate 4gm, Trypan blue 0.075gm, Crystal violet 0.008gm and Agar 15gm) after the samples were taken. The medium was prepared according the manufacturing instructions as: 90gm of the medium and 150gm sucrose were dissolved in 1liter of distilled water by heating. The dissolved components were autoclaved at 121°C for 15 minutes and left to cool to 45-50°C and just prior to pouring, 1ml of 1% sterilized potassium tellurite and 1ml of 200 units/ml sterilized bacitracin were added. Sterilization of potassium tellurite and bacitracin was performed by filtration through millipores bacterial filters. About 20ml of the medium was poured in each Petri plate, all allowed to solidify at room temperature and then stored in the refrigerator at 4°C for no more than four weeks. Identification of oral S. Mutans was confirmed by biochemical tests like mannitol and sorbitol fermentation and catalase [64] colony counting was done with a magnifying glass and the count of S. Mutans was expressed as the number of colony forming units per milliliter (cfu/ ml) of saliva. Semi quantitation of the number of colonies was done by multiplying the actual colony count with 1×10⁵ because of the part that the saliva sample was diluted one thousand times 1:5 dilution [65,66].
Figure 6: Mitis Salivarius agar media (Becton Dickinson and Difco Company, Chicago, USA), for isolation of S. mutans. .
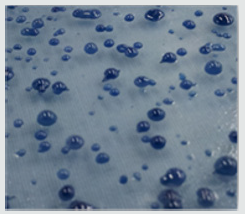
b) Lactobacillus Acidophilus Count: Second part of saliva sample were incubated on Tomato agar media for isolation of Lactobacilli for 1L of medium dissolve in distilled water [67]. Tomato agar media contains: (Glucose 10.0gm, Yeast extract 5.0gm, Polypeptone 5.0gm, KH2PO4 0.5gm, KCl 0.125gm, CaCl2.2H2O 0.125gm, NaCl 0.125gm, MgSO4.7H2O 0.125gm, MnSO4.4H2O 0.003gm, Bromocresol green 0.03gm, Canned tomato juice 150.0ml). The ingredients were heated to dissolve the components, autoclaved at 121°C for 15 minutes and left to cool. Approximately 20 ml of the medium was poured into each Petri plate and left to solidify at room temperature, then stored in refrigerator at 4°C until used. Plates were incubated within an anaerobic jar containing gas pack in the incubator for 2-4 days at 37°C. Lactobacilli were identified by colonial morphology catalase test and Gram stainingbinding agents (calcium carbonate) that confirmed it [68]. (Figure 7) Colony counting was done with a magnifying glass and the count of S. mutans and Lactobacilli was expressed as the number of colony forming units per milliliter (cfu/ml) of saliva. Semi quantitation of the number of colonies was done by multiplying the actual colony count with 1x10⁵ because of the part that the saliva sample was diluted one thousand times 1:5 dilution [69].
Chemical Tests
The 3rd part of collected saliva sample was processed to measure the salivary urea level was measured by U.V. method with (ELI TECH kit) using autoanalyzer system (Advia 1650), salivary alkaline phosphatase level was measured by kinetic method (SERAPAK ® kit) using (Advia 1650, salivary Calcium and phosphorous level by (ELI TECH kit) using micro lab analyzer spictrophoton (Micro lab 300).a) Salivary pH and Buffering Capacity
Last part of saliva samples used to measure salivary pH by using pH meter [70] (pH 18 Aqua Lytic Co, USA). Buffering capacity is determined by quantitative test using a handheld. This method involves the addition of 0.5ml of saliva to 1.5ml of 5M HCl. Mixture was vigorously shaken. Then stream of Nitrogen was passed through the mixture for 20 minutes to eliminate carbon dioxide from the sample and allowed to stand for 10 min when the final pH is measured [71].
Pilot Study
A pilot study was first conducted to establish intra-examiner reliability. ten children were selected from outpatient dental clinic for that purpose. They were examined using the dental indices (deft, DMFT, GI and PI) and subsequently recorded by the examiner and scored by the same examiner. All the patients were re-examined after 24 h. Kappa values were more than 89% for all indices, indicating good reliability.Result
Table 5: Shows the mean values, standard deviations and the statistical analysis of for sex and age.

Insignificant differences (p>0.05) NS
Data were checked, entered and analyzed by using SPSS (version 25). Data were presented as mean and Standard Deviation (SD) or quantitative variable. The qualitative data were presented as numbers and percentages and the Chi square test was used for comparison between groups. The quantitative data were presented as mean± standard deviation and the Student t-test was used for comparison between the groups. The following formulae were used in statistical analysis of results at level of significant 0.05. Normality was tested using the Shapiro-Wilk test. (Table 5) shows the characteristics of study participants. No group differences were found in participant age and sex (P > 0.05). Since no statistically significant differences were found between sex and age so that, data were combined for them. Table 6 shows that salivary concentration of Ca, Phosphorous, alkaline and phosphatase which these values did not differ between the two groups (P>0.05). On the other side, the salivary pH, S. mutans and Lactobacillus count were significantly higher in salivary samples obtained from study group (P< 0.001). Additionally, buffering capacity were significantly higher (P < 0.05) in study group. PI were significantly higher in study group (P < 0.05), however, dmft and DMFT were significantly higher in control group (P< 0.001) and GI did not differ between both groups (P>0.05). (Table 7) shows the study group had significantly more enamel hypoplasia (46%) than the control group (6%). The presence of extrinsic stain and intrinsic stain is statically increase in study group (P< 0.05). All ages with the disease duration of less than one year showed no clinical evidence of enamel hypoplasia, and the oldest age group, from 6 to 12 years, showed the highest number of enamel hypoplasia records (eleven patients) (Table 5).
Table 6: Shows the mean values, standard deviations and the statistical analysis of the oral variables using the Student t-test.
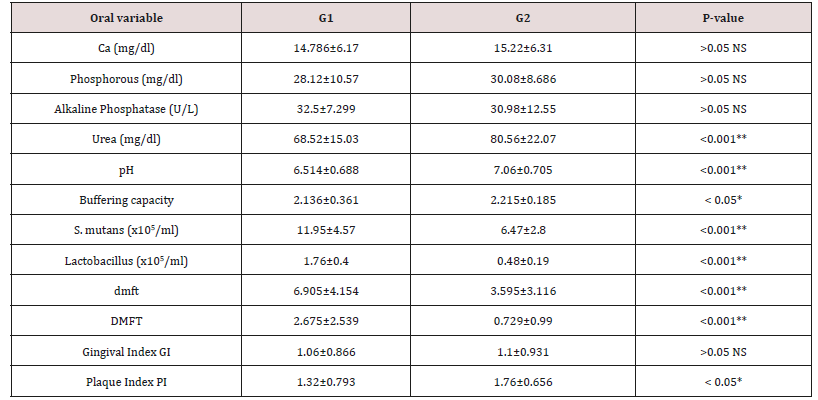
Significant differences (P < 0.05) * Highly significant differences (P < 0.001) ** Insignificant differences (p > 0.05) NS

Table 7: Distribution of tooth discoloration and enamel hypoplasia in study and control groups using Chi-square test.
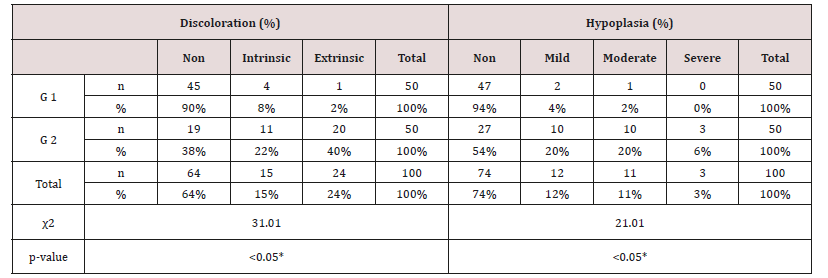
Significant differences (P < 0.05) *

Table 8: Distribution of children in study group with enamel hypoplasia, according to the age of onset and duration of the disease.


Table 9: Daily tooth-brushing frequency (%) and dental check-up frequency in study and control group using Chi-square test.

Insignificant differences (p > 0.05) NS

Discussion
As regards frequency of enamel hypoplasia, in this finding, there was 94% had no hypoplasia, 4% had mild hypoplasia and 2% had moderate hypoplasia in G1 while there was 54% had no hypoplasia, 20% had mild hypoplasia, 20% had moderate hypoplasia and 6% sever hypoplasia in study group. These reports agreed with earlier workers [72,84]. Also, Nunn JH et al. [72] reported that, 83% of their renal patients had enamel defects. Many authors [72,81] stated that, calcium depletion with renal impairment during mineralization of the developing dentition, often resulting in enamel hypoplasia, is a likely sequela. There was an evident correlation between the location on the teeth of hypoplastic changes and the age of onset of severe renal failure, which was like the findings of (Table 8). Koch MJ et al. [82] who investigated the exfoliated primary teeth of CRF or ESRD patients microscopically and showed that enamel hypoplasia was limited to postnatal enamel, and hypoplasia increases with the duration of the disease and the early onset. Tooth discoloration was increased in CRF patients significantly. The stain may be intrinsic or extrinsic (Table 8). Extrinsic stain can be readily removed from the surface of the teeth with an abrasive prophylactic material. As regards frequency of tooth discoloration (%) in present study, there was 90% had not discoloration, 8% had intrinsic discoloration and 2% had extrinsic discoloration in control group while there was 38% had no discoloration, 22% had intrinsic discoloration and 40% had extrinsic discoloration in study group. There were significant differences between both groups as regards all items (P< 0.05). Intrinsic staining is generally a result of adsorption of pathological pigments onto the dentine matrix. Brown discoloration can be seen when uremia is present during development of the dentitions. Intrinsic stains are also seen in some haemodialysis patients resulting from the use of tetracycline to treat infection during the period of calcification of the primary and permanent teeth. Intrinsic stains in our study group were not related to tetracycline use since the patients’ physicians were aware that tetracycline could stain developing teeth and did not prescribe it. Our findings of intrinsic brown staining in 22% of patients may be due to the presence of uremia during the development of the dentitions; this agrees with previous reports [81,84]. The children with CRF were being treated for anemia with ferrous sulfate in syrup form, which caused the black-brown extrinsic staining on the teeth [73]. Although, the mean of Plaque Index score was significantly greater in the CRF children compared with the controls, there was no significant difference in gingival inflammation, which agrees with results of earlier researchers [72,84-86]. The gingiva in individuals with CRF can be pale due to anemia, with possible loss of the demarcation of the mucogingival junction and when there is platelet dysfunction, the gingiva may bleed easily [87-90]. This is attributed to a modified tissue response because of immunocompromised. In addition, anemia is a common problem in patients with CRF and it is possible that gingival inflammation is masked by the paleness of the gingiva. However, another study revealed that, accelerated periodontal disease in patients with renal failure, possibly related to impaired white cell function [91]. Jaffe EC et al. [73] who found that, plaque amounts were similar in both groups, but the gingival status was lower for the ESRD patients. Davidovich et al. [49] reported that, the patients suffering from (ESRF) and those receiving dialysis are more prone to periodontal disease and other oral health problems. The renal failure patients had higher gingival index (GI) and bleeding; probing depths, attachment loss, hypoplasia, obliteration and less caries. It appears that patients with uremia undergoing haemodialysis have a reduced gingival inflammatory response to bacterial dental plaque compared with the controls. As regards daily tooth brushing (%) and periodic dental check-up (%), in present study, there was 90% not perform tooth brushing at all and 10% performing it once daily in control group while there was 88% not perform tooth brushing at all and 12% performing it once daily at least in patients group with insignificant difference in oral health status between both groups (P>0.05). There was 92% not perform periodic dental check-up at all 6% perform it rarely and 4% perform it regularly in control group while there was 96% not perform periodic dental check-up at all, 2% perform it rarely and 2% perform it regularly in study the group with insignificant difference between both groups (P>0.05). It is likely to relation between the patients’ level of education and low socioeconomic status (Table 9). These findings indicate that there is a need for dental health education for all children and their parents.
Conclusion
Recommendation
Acknowledgement
The authors wish to thank all children, participants and their parents or guardians for their valuable participation in this study. This study was supported clinically by all staff of pediatric department, clinical pathology department and microbiology department of Faculty of Medicine in Zigzag University. We would like to thank Professor Ali MM Abu Zeid, Professor of Pediatric Department Zigzag University and Professor. Samy Y. Elbayoumy, Head of Pedodontic and Dental Public Health Department, Faculty of Dental medicine, Al-Azhar University for their continuous encouragement, cooperation and support. This study was supported by self-fund of authors.
Read More Lupine Publishers Pediatric Dentistry Articles : https://lupine-publishers-pediatric-dentistry.blogspot.com/
Read More Lupine Publishers blogger Articles : https://lupinepublishers.blogspot.com
